Improvement of AD risk scores by use of the Aβ1-42/Aβ1-40 ratio
Previous posts in this series:
- Use of the Aβ1-42/Aβ1-40 ratio to improve accuracy of AD diagnosis
- Aβ1-42/Aβ1-40 ratio for interpretation of discordant results
Don't miss the upcoming related Insight articles over the next weeks and get deeper information on the value of using Aβ1-42/Aβ1-40 ratio. Or simply download the complete guidance document now! (requires a Premium eServices account)
Different scores have been developed to provide an interpretation of biomarker results for AD diagnosis or risk prediction. Here we will give two examples on the impact of Aβ1-42/Aβ1-40 ratio on risk scores.
Erlangen Score
- Risk scores or algorithms (like Erlangen score or PLM score) are improved by implementing the Aβ1-42/Aβ1-40 ratio into the respective algorithm.
- Use of the Aβ1-42/Aβ1-40 ratio especially reduces discrepancies in biologically doubtful cases and can therefore increase the confidence in the diagnosis.
The Erlangen score uses a risk graph approach. A comparison of the Erlangen score obtained with three (use of only tTau, pTau, and Aβ1-42) and with four biomarkers (use of tTau, pTau, Aβ1-42, and Aβ1-42/40 ratio) as done in the Erlangen score validation study2 clearly shows that the results based on four biomarkers correlate better with the percent of the subjects progressing to AD dementia than the scores calculated with three biomarkers only (compare the light grey versus dark grey bars in fig. 2). Not including the Aβ1-42/40 ratio leads to a counterintuitive result that the proportion of the subjects progressing to AD dementia is larger in the group with a lower score. This might be cautiously considered as another argument favouring the “four-biomarkers” approach, which is also in agreement with other studies confirming better diagnostic performance of the Aβ1-42/1-40 ratio compared to the Aβ1-42 concentration alone.
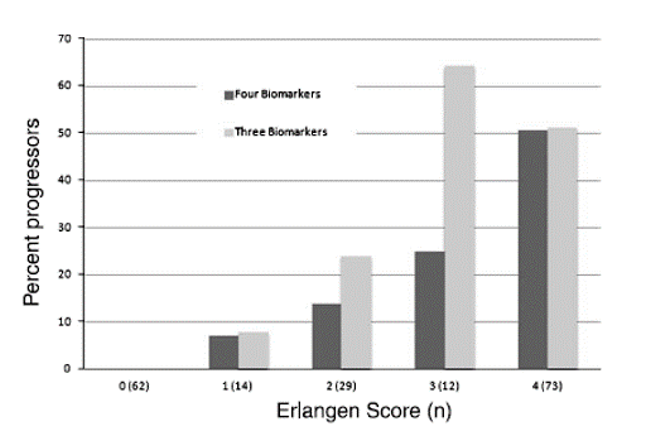
Figure 2 From: Lewczuk et al. Journal of Alzheimer's Disease 2015: Percentage of the DCN subjects in the MCI stage progressing to AF in the follow-up time (1-4 years). Light grey bars indicate the results when only three biomarkers (Aβ1-42, tTau and pTau181) were considered; dark-grey bars indicate the results when four biomarkers (Aβ1-42, Aβ42/40 ratio, tTau, and pTau181) were considered. In brackets, the total number of patients with a given score is presented in the four-biomarker model.
PLM Scale / PLMR scale
The PLM Scale uses the results of the three AD biomarkers Aβ1-42, tTau and pTau1. Recently, Lehmann et al. published an optimized PLMR score, that integrates the CSF Aβ1-42/Aβ1-40 ratio instead of the Aβ1-42 value alone. In a study with two independent cohorts it could be demonstrated that this PLMR scale could better define AD patients in a clinical routine in a memory centre. The number of discordant biomarker profiles have been significantly reduced by integrating the Aβ1-42/Aβ1-40 ratio into the PLM scale.
Including the Aβ1-42/Aβ1-40 ratio into this tool helps especially in reducing the discrepancies in biologically doubtful cases and can therefore increase the confidence in the diagnosis1.
Non-pathologic biomarkers in PLM scale are defined as below cut-off for Aβ1-42, above cut off for tTau and pTau.
Non-pathologic biomarkers for PLMR scale are defined as below cut-off for Aβ1-42/Aβ1-40 ratio, above cut off for tTau and pTau.
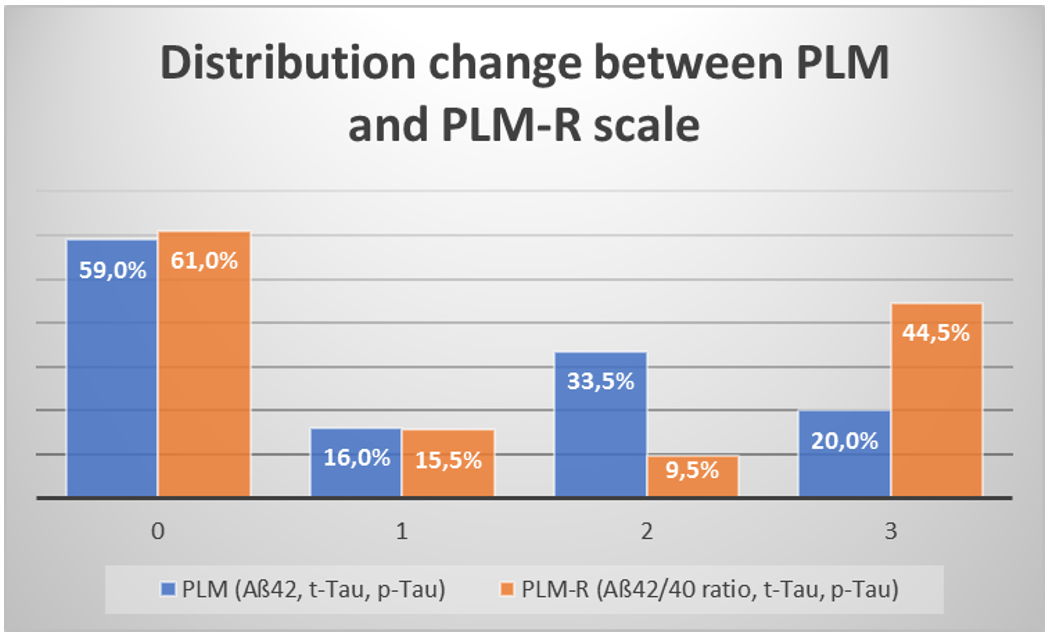
Figure 3 Adapted from: Lehmann et al. Frontiers in Aging Neuroscience 2018 PLM scale and PLMR scale group distributions in one of the two tested cohort (AD and NAD subjects): Scale 0: No pathologic biomarker (predictive value for AD 9.6%), Scale 1: 1 pathologic biomarker out of three (predictive value for AD 24.7%), Scale 2: 2 pathologic biomarkers out of three (predictive value 77.2%), Scale 3: All 3 biomarkers are pathologic (predictive value 94.2%)
References
- Lehmann, Sylvain, et al. "Relevance of Aβ42/40 ratio for detection of Alzheimer Disease pathology in clinical routine: The PLMR scale." Frontiers in Aging Neuroscience 10 (2018): 138.
- Lewczuk, Piotr, et al. "Validation of the Erlangen score algorithm for the prediction of the development of dementia due to Alzheimer’s disease in pre-dementia subjects." Journal of Alzheimer's Disease 48.2 (2015): 433-441.
Don't miss the next posts on this topic in the following weeks:
Related articles

Integration of ADx NeuroSciences within Fujirebio unleashes a world of new possibilities
Fujirebio Europe N.V. will formally and fully integrate ADx NeuroSciences N.V. into its organization on April 1, 2026. This completes a process that...

Fujirebio introduces its Neuro Expert Toolbox (NExT) at AAIC 2025
Fujirebio is introducing its Neuro Expert Toolbox (NExT) for the first time at AAIC 2025 (Alzheimer's Association International Conference®) in...

Video - Alzheimer's awareness redefined
Follow the journey of the Sullivan family and leading Alzheimer’s Neurologist and Researcher Dr. David Greeley as they introduce and explain these...

Publication - Serum and cerebrospinal fluid neurofilament light chains measured by SIMOA™, Ella™, and Lumipulse™ in multiple sclerosis naïve patients
We would like to draw your attention to a first publication on our Lumipulse® G NfL solution. In this article you will find a method comparison of CSF...

CTAD 2023 – Spotlight on recent advances in blood-based biomarkers for Alzheimer’s disease
Both fluid and imaging biomarkers provide biological evidence for the underlying etiology of cognitive impairment. The core fluid biomarkers of...

IVDR status update for Fujirebio’s Neuro products
The European CE-marking is used to support registrations of in vitro diagnostic (IVD) medical devices in many jurisdictions around the world. The...
Scientific poster - Blood sample matrix validation, impact of sample freezing and method comparison analysis using the Lumipulse® G NfL blood prototype assay
This AD/PD 2023 poster investigates the agreement between matched serum and plasma samples on the Lumipulse G NfL Blood prototype assay, the impact of...

Video - A neurochemist's search to save memories
Meet Dr. Charlotte Teunissen, Professor in Neurochemistry, and her lifelong friend Christa Reinhoudt, who was diagnosed with Alzheimer's disease in...
Scientific poster - Analytical performance of the Lumipulse® G NfL CSF <RUO>
Poster presented at the AD/PD 2023
This AD/PD 2023 poster wishes to demonstrate the analytical performance of the newly developed Lumipulse G NfL CSF...
Scientific poster - CSF pTau181/Aβ1-42 ratio increases pre-analytical variability over measuring Aβ1-42 alone
In this CTAD 2022 poster, we examine the utility of CSF biomarker ratios to correct for pre-analytical variability.
Scientific poster - A fully automated and scalable plasma pTau181 assay for Alzheimer's disease
In this article, the diagnostic performance of a modified version of the Lumipulse G pTau181 CSF test is evaluated.

New criteria for Alzheimer’s disease
New criteria for different stages of AD have been suggested by the International Working Group (IWG) and the National Institute on Aging-Alzheimer’s...
Aβ deposition and clearance: a key feature of the ageing brain
This chapter looks closer at Aβ deposition and clearance as key feature of ageing brain.
Scientific poster - Reducing misdiagnosis of Alzheimer’s disease pathology utilizing CSF and amyloid PET
In this poster we examine the performance of cognitive testing alone for identification of amyloid positivity in MCI patients from the ADNI study when...
Scientific poster - Analytical performance overview of the Lumipulse® G pTau 181 Plasma RUO assay
The aim of the study, presented at the AAIC 2022, was to determine the performance of several analytical parameters, including amongst others...
Scientific poster - Analytical performance of the Lumipulse® G β-Amyloid 1-40 Plasma and Lumipulse® G β-Amyloid 1-42 Plasma RUO assays
The aim of the study, presented at the AAIC 2022, was to determine the performance of several analytical parameters, including amongst others...
CSF biochemical pattern interpretation
What are some of the best-practices of CSF biochemical pattern interpretation? In this article series we aim at highlighting the current state of...
Handling and transportation of CSF samples
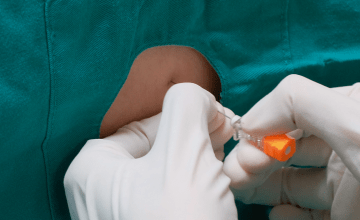
Cerebrospinal fluid (CSF) can be collected in the lumbar region by an experienced physician. This article details the recommended procedure for...
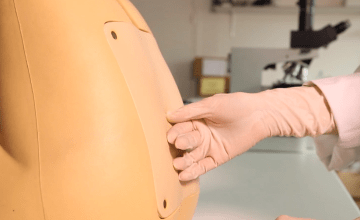
How to perform a lumbar puncture
In this article series we aim at highlighting the current state of knowledge and the latest developments in the field of Alzheimer’s disease (AD)...
Using CSF biomarkers to link pathology and clinical presentation
In this article series we aim at highlighting the current state of knowledge and the latest developments in the field of Alzheimer’s disease (AD)...

Video - A day at the Fujirebio Neuro Center of Excellence
In this short video we show you around at the Fujirebio Neuro Center of Excellence. Right now, expectations are high for the development of blood...
Altered proteins in brain neurodegenerative diseases
In this new article series we aim at highlighting the current state of knowledge and the latest developments in the field of Alzheimer’s disease (AD)...
Scientific poster - Comparing CSF and plasma LUMIPULSE® Alzheimer’s Disease biomarker analysis to amyloid-β PET imaging
The aim of this study was to evaluate a plasma pTau biomarker as a tool for predicting amyloid pathology.
Improving clinical diagnosis of Alzheimer’s disease: Review of the available literature
In this chapter, we will review available literature on the accuracy of the underlying pathological determinations in mild cognitive impairment (MCI)...
The drawbacks of relying solely on the standard routine clinical examinations and cognitive testing
Many subtypes of disease exist under the umbrella of dementia with Alzheimer’s disease (AD) being the most common. AD-related dementia is...

Testimonial - Value of the β-Amyloid ratio and other CSF biomarkers in the Erlangen Score interpretation algorithm
By Prof. Dr. Piotr Lewczuk - Two groups of established cerebrospinal fluid (CSF) biomarkers reflect two major pathological alterations in Alzheimer's...
Scientific poster - Towards an easy plasma pTau 181 detection
Blood-based Alzheimer’s disease (AD) biomarker testing could be used as a simple, accessible, and scalable approach to help support the diagnosis of...
Video - The interest of automated testing for all four CSF biomarkers
In less than 2 minutes, this video explains the advantages of automated biomarker testing for all four CSF biomarkers, over other available testing...
Webinar replay - Preparing for the future of plasma based Alzheimers disease diagnostics
At Fujirebio we are hosting a webinar series with leading expert speakers dedicated to current topics in the field of Alzheimer's disease diagnostics...

The Fujirebio Neuro Center of Excellence
The Fujirebio Neuro Center of Excellence has been founded with the objective of rising to this challenge. It is a research and development hub focused...
Booklet - First edition of our new clinical booklet "A few drops of insight can lead to an ocean of understanding"
Early diagnosis of Alzheimer's disease is crucial. The desire to tackle neurodegenerative diseases by always finding earlier diagnostic solutions and...

Video - Ratio calculation of Aβ1-42 and Aβ1-40 offers essential information about the buildup of amyloid pathology in a patient's brain
This 2 minute video explains why and how a ratio calculation of the two amyloid proteins, Aβ1-42 and Aβ1-40, offers particularly essential information...

Video - Daniel's story about his early testing and diagnosis of Alzheimers disease
Daniel lives in Stockholm, Sweden, and was diagnosed with Alzheimer’s disease when he was still in his early 50's. In this 6-minute video we follow...
Influence of automation on Aβ1-42/Aβ1-40 ratio and its use
Automation is an important step in the direction of more standardization as it limits the number of manual handling steps and therefore minimizes...

Comparison of Aβ1-42/Aβ1-40 ratio with other ratios
CSF Aβ1-42/Aβ1-40 is a tool to normalize values of patients with different amyloid levels, as other ratios might be seen more as interpretation tools...
How to work with Aβ1-42/Aβ1-40 ratio
One cause of discordant results can be the preanalytical conditions, e.g. when laboratories use tubes that bind certain proteins. Aβ1-42 adsorption is...

Aβ1-42/Aβ1-40 ratio for interpretation of discordant results
By use of the Aβ1-42/Aβ1-40 ratio, discordant results (i.e. when amyloid and tau biomarkers are not concordant) can be improved. However, while the...

Use of the Aβ1-42/Aβ1-40 ratio to improve accuracy of AD diagnosis
It is widely agreed that, since cerebrospinal fluid (CSF) is in direct contact with the central nervous system (CNS), analytes measured in this body...

What is Alzheimer's disease?
Alzheimer’s disease, which is the most common form of dementia, is an incurable degenerative disease. Neurons in certain parts of the brain are...

 Powered by Bioz


 and Lumipulse G pTau 181 Calibrators set (230367)")


 and Lumipulse G β-Amyloid 1-40 Calibrators (231531)")

 and Lumipulse G β-Amyloid 1-42 Calibrators (230343)")