Testimonial - Value of the β-Amyloid ratio and other CSF biomarkers in the Erlangen Score interpretation algorithm
By Prof. Dr. Piotr Lewczuk, Professor of Neurochemistry and Head, Laboratory for Clinical Neurochemistry and Neurochemical Dementia Diagnostics, Department of Psychiatry and Psychotherapy, Universitätsklinikum Erlangen, Germany
Two groups of established cerebrospinal fluid (CSF) biomarkers reflect two major pathological alterations in Alzheimer's disease (AD): accumulation of amyloid β (Aβ) peptides in the brain parenchyma and neurodegeneration process accompanied by intracellular deposition of neurofibrillary tangles composed of molecules of (hyperphosphorylated) Tau.
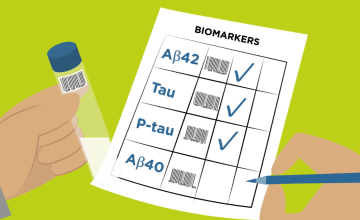
Decreased concentrations of Aβ peptides ending at the C-terminus of 42 (Aβ42) and/or decreased ratio of Aβ42/40, along with elevated CSF levels of Tau and/or pTau represent the classic pattern of the CSF changes in AD.
Every human being produces Aβ peptides, by enzymatic processing of ubiquitously expressed transmembrane Amyloid Precursor Proteins (APP), beginning already in the prenatal stage and until death. The physiological role of the Aβ peptides is still unclear, but it is astonishing that an adult subject without Aβ peptides in the CSF has never been reported, which might lead to a speculation that they are - in some way - crucially important to survive.
Releasing of Aβ peptides from APP is an entirely physiological process. Pathology starts only then when, for still unclear reasons, Aβ monomers begin to accumulate to form extremely neurotoxic soluble oligomers.
When the process continues, oligomers turn into longer forms, fibrils, which, at some moment, cease to be soluble and start accumulating into plaques. A local neuroinflammation appears around the plaques followed by occurrence of neurodegeneration. Dying neurons release Tau molecules, along with their hyperphosphorylated forms, probably when the capacities of the brain to sustain accumulation of Aβ peptides are exceeded.
It takes approximately 20 years from the onset of the pathological processes (oligomerization of Aβ monomers) to the first clinically visible symptoms, i.e. the stage of mild cognitive impairment (MCI). This means that we are able to diagnose (or at least suspect) AD with CSF biomarkers about two decades before the onset of the clinical symptoms.
Twenty years ago, the Lab for Clinical Neurochemistry in Erlangen (Germany) was the first center which established the CSF Aβ42/40 concentration ratio as a routine diagnostic biomarker in AD, with inspiring ideas coming from different directions.
Since then, dozens of studies have reconfirmed improved performance of the Aβ42/40 ratio, compared to the Aβ42 concentration alone, as a diagnostic and prognostic biomarker in AD. Consequently, around 2015 several centers worldwide started using the Aβ42/40 ratio as a routine diagnostic tool.
Considering that it is only the numerator of the quotient (concentration of Aβ42) which is altered in AD, with the denominator (concentration of Aβ40) remaining practically unchanged, a question appears why normalizing the Aβ42 concentration to the concentration of the most abundant Aβ peptide, Aβ40, leads to a much better separation of AD and non-AD subjects.
A more elaborated answer to this question requires analysis of the distribution of a ratio of two stochastically proportional random variables and the relations of their measures of dispersion (variances).
This leads to a mathematically-proven conclusion that better diagnostic Aβ42/40 performance is backed up by fundamental laws of probability, which we present elsewhere[1] and can be summarized as follows: consider three groups of persons, whose Aβ42 and Aβ40 concentrations follow some distributions (as a matter of fact, at least for Aβ40, it was shown that this distribution is almost perfectly normal).
This means that under physiological conditions, a great majority of the population has average concentrations of Aβ42 and Aβ40. However, there exist persons with either very high (at the right tail of the distribution) or very low (at the left side of the distribution) physiologic concentrations of Aβ peptides.
When a person from the middle part of the distribution develops AD, his Aβ42 concentration decreases and ends up below some laboratory’s reference range; this leads to a rather clear interpretation (Fig. 1, left part).
Also, a person with high concentrations of the two peptides (right tail of the distribution) will have, under condition of AD, a decreased Aβ42 concentration, which, however, will remain relatively high due to a high starting concentration; hence it will remain above the laboratory cut-off (Fig. 1, middle part). Based on Aβ42 alone, not knowing the starting level (which we never know) and neglecting Aβ40 this will lead to a false-negative interpretation.
Figure 1:
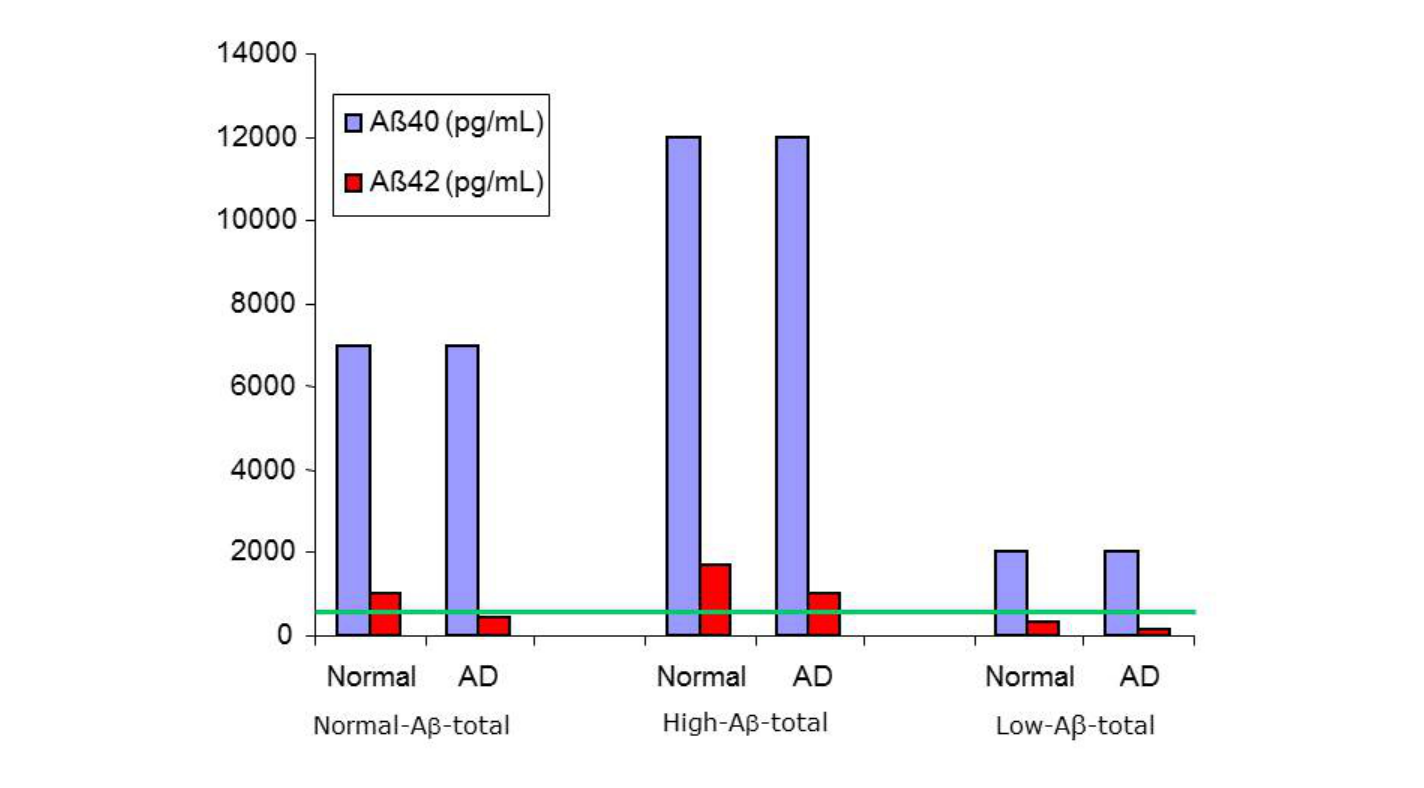
But an even worse situation occurs in the subjects from the lower (left tail) side of the Aβ distribution. Their Aβ42 concentration, already under physiologic conditions, is so low that we would (biochemically) diagnose them as AD patients, with all possible socio-medical consequences.
The error we make in this approach is due to the application of cross-sectional laboratory reference ranges to analyze longitudinal evolution of the biomarkers (a similar mistake is often made when so-called baby growth percentile curves are used to infer whether development of a given child remains in a "proper channel").
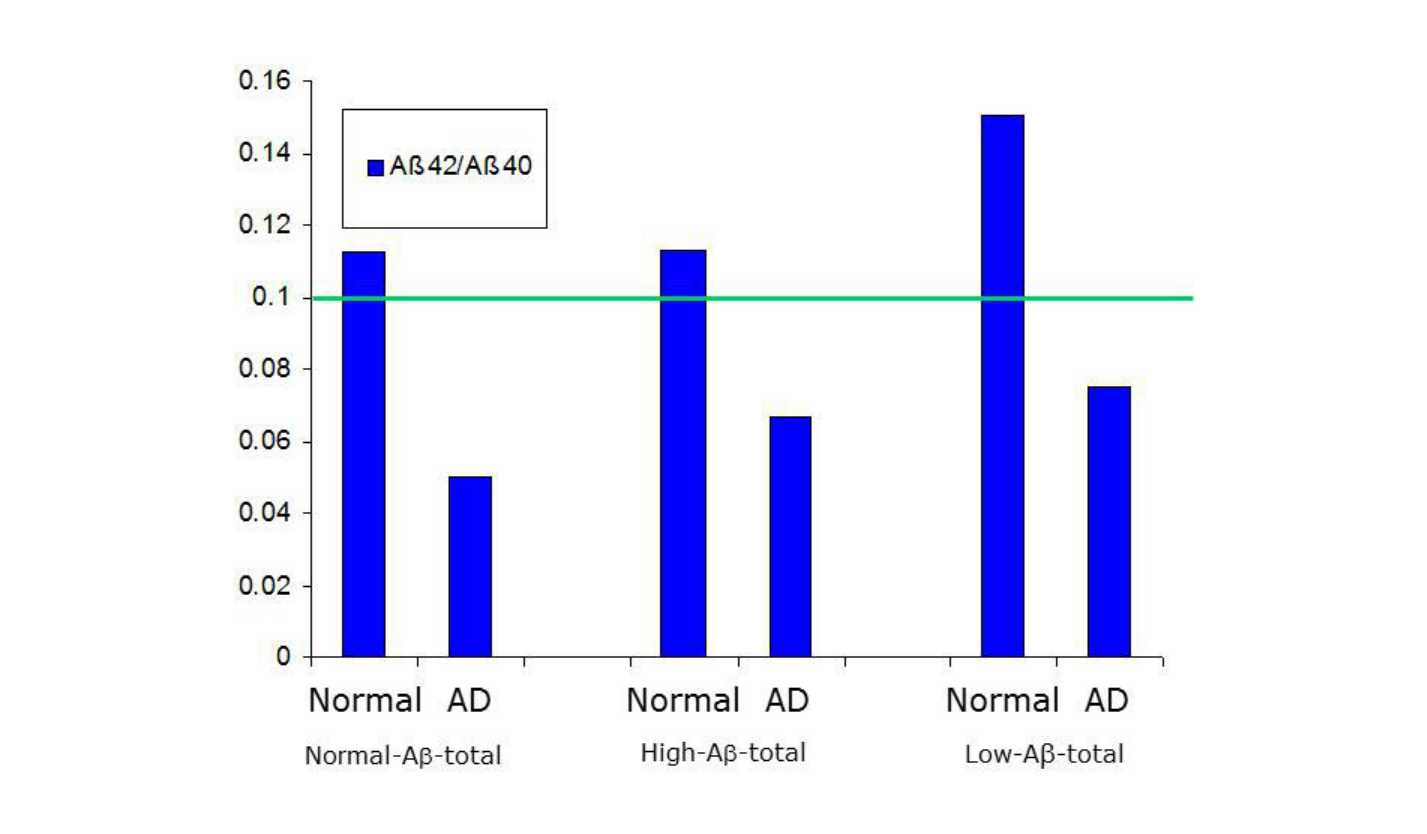
In all three situations described above, what corresponds to the real (patho)physiological situation, is the Aβ42/40 ratio (Fig. 2).
Figure 2:
The two groups of the CSF biomarkers show high diagnostic accuracy, and are routinely used as an AD diagnostics tool in many countries. However, their global acceptance is hampered because of lack of comparability of the results generated in different laboratories, for example due to different analytical platforms used.
This has already been addressed, to some extent, by efforts to standardize procedures for collection of samples, assays calibrators, and measurements protocols (including automation); however, the global acceptance of these novel approaches will certainly need time.
In addition, as the AD CSF biomarkers are more often measured in the clinical routine, interpretation of these results require some expertise. It is rarely the case that the CSF AD biomarkers fall into clear-cut normal/abnormal categories, particularly at very early stages of the disease.
In order to harmonize the diagnostic-oriented interpretation of the CSF profiles, the Erlangen Score (ES) interpretation algorithm was proposed and extensively validated on the ground of well-characterized patient cohorts from European and US centers.
According to the Erlangen Score, a result of the CSF analysis with all biomarkers normal is scored with 0 points, and interpreted as "no neurochemical evidence for AD"; a pattern with border zone changes in one biomarkers group (either Aβ or Tau/pTau, but not both) results in the score of 1, and is reported as "neurochemically improbable AD"; a CSF result with evident alterations in either Aβ metabolism (decreased Aβ42 concentration or Aβ42/Aβ40 ratio) or tau metabolism (increased Tau levels and/or pTau181) but not both is scored 2 points; the same score is given in the case of border zone alterations in the CSF biomarkers of both groups.
A result with evident changes in one biomarkers' group (either Aβ or Tau) accompanied by border zone alterations in the other group is scored 3 points; these two cases (with the ES = 2 or 3) are interpreted as "neurochemically possible AD".
Evident changes in both Aβ and Tau groups result in 4 points, and are interpreted as "neurochemically probable AD".
Isolated, very high Tau concentration is reported as suspected rapidly progressing neurodegeneration with improbable AD.
The Erlangen Score pattern can be summarized and reported to clinicians in a graphical form as presented in Fig. 3 (originally published in [2]; © 2017 the Authors).
Figure 3:
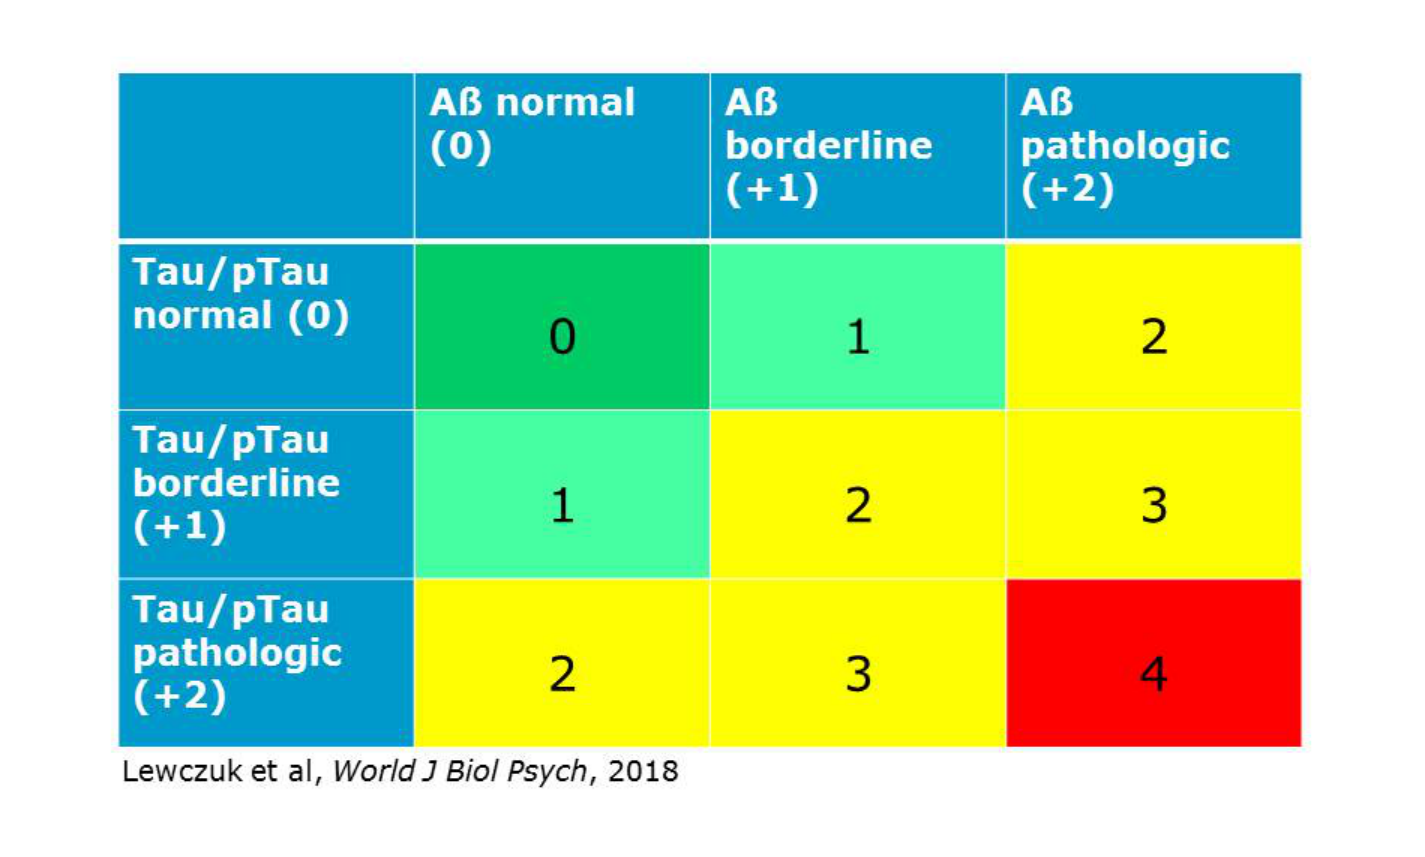
One of the key concepts in the ES algorithm are the "border zone" results. They need to be defined by each laboratory, with a suggested value of about 10%.
Irrespective of the magnitude, however, it is important to note that border zones of the ES are asymmetric; they exclusively affect results on the pathologic side of the reference value. For example, with the reference value of Aβ42/40 ratio in Erlangen laboratory being 0.06, all results above this cut off are considered entirely normal, but results within 0.055 - 0.06 are interpreted as “borderline pathologic”.
Similarly, results of Tau concentrations lower than 415 pg/mL are considered normal, but results within 415 - 455 pg/mL are considered borderline pathologic. Such asymmetric interpretation has ethical reasons; we believe it is ethically more correct to underdiagnose patients, by accepting a higher percentage of false negative results, than to overdiagnose (by making more false positive errors).
ES shows clear advantages compared to other interpretational approaches. It enables categorization of the CSF results into five classes on an ordinal scale (0 - 4), with an increasing level of pathological changes of the CSF biomarkers in AD.
Furthermore, it includes, for the first time in the interpretation of the AD biomarkers in CSF, the idea of the border zone results.
This is clearly opposite to a dichotomous approach (CSF normal/pathologic) applied in earlier interpretations.
In addition, ES is less complicated and more robust in comparison to regression-based approaches or decision trees; for use in every-day laboratory routine in the Lab for Clinical Neurochemistry in Erlangen it has been fully automated, including graphical representation, with just a dozen lines of programming code.
Compared to the otherwise very reliable A/T/N classification[3], ES stratifies individuals into classes on an ordinal scale, and not into entirely descriptive categories, which enables at least semi-quantitative correlation of the CSF findings with other metrics (such as odds ratios, MCI-to-dementia progression hazards, or quantitative results of neuroimaging).
Finally, and perhaps most importantly, ES is very flexible, enabling inclusion of further potentially interesting biomarkers (as long as they reflect amyloid pathology or neurodegeneration at least on an ordinal scale) without the necessity to recalculate the number of categories. This makes ES different from other published algorithms, e.g. the Paris-Lyon-Montpellier Scale[4] based on the number of the pathologic CSF biomarkers. Irrespective of the number of the biomarkers considered, the ES will always classify the CSF patterns into five ordinal categories.
References
- Lewczuk et al., Diagnostics (Basel), 2021, 11(12): 2372.
- Lewczuk et al., World J Biol Psychiatry, 2018, 19(4): 244-328.
- Jack et al., Alzheimers Dement, 2018, 14(4): 535-562.
- Lehmann et al., Front Aging Neurosci, 2018, 10:138.
Related articles

Integration of ADx NeuroSciences within Fujirebio unleashes a world of new possibilities
Fujirebio Europe N.V. will formally and fully integrate ADx NeuroSciences N.V. into its organization on April 1, 2026. This completes a process that...

Fujirebio introduces its Neuro Expert Toolbox (NExT) at AAIC 2025
Fujirebio is introducing its Neuro Expert Toolbox (NExT) for the first time at AAIC 2025 (Alzheimer's Association International Conference®) in...

Video - Alzheimer's awareness redefined
Follow the journey of the Sullivan family and leading Alzheimer’s Neurologist and Researcher Dr. David Greeley as they introduce and explain these...

Publication - Serum and cerebrospinal fluid neurofilament light chains measured by SIMOA™, Ella™, and Lumipulse™ in multiple sclerosis naïve patients
We would like to draw your attention to a first publication on our Lumipulse® G NfL solution. In this article you will find a method comparison of CSF...

CTAD 2023 – Spotlight on recent advances in blood-based biomarkers for Alzheimer’s disease
Both fluid and imaging biomarkers provide biological evidence for the underlying etiology of cognitive impairment. The core fluid biomarkers of...

IVDR status update for Fujirebio’s Neuro products
The European CE-marking is used to support registrations of in vitro diagnostic (IVD) medical devices in many jurisdictions around the world. The...
Scientific poster - Blood sample matrix validation, impact of sample freezing and method comparison analysis using the Lumipulse® G NfL blood prototype assay
This AD/PD 2023 poster investigates the agreement between matched serum and plasma samples on the Lumipulse G NfL Blood prototype assay, the impact of...

Video - A neurochemist's search to save memories
Meet Dr. Charlotte Teunissen, Professor in Neurochemistry, and her lifelong friend Christa Reinhoudt, who was diagnosed with Alzheimer's disease in...
Scientific poster - Analytical performance of the Lumipulse® G NfL CSF <RUO>
Poster presented at the AD/PD 2023
This AD/PD 2023 poster wishes to demonstrate the analytical performance of the newly developed Lumipulse G NfL CSF...
Scientific poster - CSF pTau181/Aβ1-42 ratio increases pre-analytical variability over measuring Aβ1-42 alone
In this CTAD 2022 poster, we examine the utility of CSF biomarker ratios to correct for pre-analytical variability.
Scientific poster - A fully automated and scalable plasma pTau181 assay for Alzheimer's disease
In this article, the diagnostic performance of a modified version of the Lumipulse G pTau181 CSF test is evaluated.

New criteria for Alzheimer’s disease
New criteria for different stages of AD have been suggested by the International Working Group (IWG) and the National Institute on Aging-Alzheimer’s...
Aβ deposition and clearance: a key feature of the ageing brain
This chapter looks closer at Aβ deposition and clearance as key feature of ageing brain.
Scientific poster - Reducing misdiagnosis of Alzheimer’s disease pathology utilizing CSF and amyloid PET
In this poster we examine the performance of cognitive testing alone for identification of amyloid positivity in MCI patients from the ADNI study when...
Scientific poster - Analytical performance overview of the Lumipulse® G pTau 181 Plasma RUO assay
The aim of the study, presented at the AAIC 2022, was to determine the performance of several analytical parameters, including amongst others...
Scientific poster - Analytical performance of the Lumipulse® G β-Amyloid 1-40 Plasma and Lumipulse® G β-Amyloid 1-42 Plasma RUO assays
The aim of the study, presented at the AAIC 2022, was to determine the performance of several analytical parameters, including amongst others...
CSF biochemical pattern interpretation
What are some of the best-practices of CSF biochemical pattern interpretation? In this article series we aim at highlighting the current state of...
Handling and transportation of CSF samples
Cerebrospinal fluid (CSF) can be collected in the lumbar region by an experienced physician. This article details the recommended procedure for...
How to perform a lumbar puncture
In this article series we aim at highlighting the current state of knowledge and the latest developments in the field of Alzheimer’s disease (AD)...
Using CSF biomarkers to link pathology and clinical presentation
In this article series we aim at highlighting the current state of knowledge and the latest developments in the field of Alzheimer’s disease (AD)...
Video - A day at the Fujirebio Neuro Center of Excellence
In this short video we show you around at the Fujirebio Neuro Center of Excellence. Right now, expectations are high for the development of blood...
Altered proteins in brain neurodegenerative diseases
In this new article series we aim at highlighting the current state of knowledge and the latest developments in the field of Alzheimer’s disease (AD)...
Scientific poster - Comparing CSF and plasma LUMIPULSE® Alzheimer’s Disease biomarker analysis to amyloid-β PET imaging
The aim of this study was to evaluate a plasma pTau biomarker as a tool for predicting amyloid pathology.
Improving clinical diagnosis of Alzheimer’s disease: Review of the available literature
In this chapter, we will review available literature on the accuracy of the underlying pathological determinations in mild cognitive impairment (MCI)...
The drawbacks of relying solely on the standard routine clinical examinations and cognitive testing
Many subtypes of disease exist under the umbrella of dementia with Alzheimer’s disease (AD) being the most common. AD-related dementia is...
Scientific poster - Towards an easy plasma pTau 181 detection
Blood-based Alzheimer’s disease (AD) biomarker testing could be used as a simple, accessible, and scalable approach to help support the diagnosis of...
Webinar replay - Preparing for the future of plasma based Alzheimers disease diagnostics
At Fujirebio we are hosting a webinar series with leading expert speakers dedicated to current topics in the field of Alzheimer's disease diagnostics...

Video - The interest of automated testing for all four CSF biomarkers
In less than 2 minutes, this video explains the advantages of automated biomarker testing for all four CSF biomarkers, over other available testing...

The Fujirebio Neuro Center of Excellence
The Fujirebio Neuro Center of Excellence has been founded with the objective of rising to this challenge. It is a research and development hub focused...
Booklet - First edition of our new clinical booklet "A few drops of insight can lead to an ocean of understanding"
Early diagnosis of Alzheimer's disease is crucial. The desire to tackle neurodegenerative diseases by always finding earlier diagnostic solutions and...

Video - Ratio calculation of Aβ1-42 and Aβ1-40 offers essential information about the buildup of amyloid pathology in a patient's brain
This 2 minute video explains why and how a ratio calculation of the two amyloid proteins, Aβ1-42 and Aβ1-40, offers particularly essential information...

Video - Daniel's story about his early testing and diagnosis of Alzheimers disease
Daniel lives in Stockholm, Sweden, and was diagnosed with Alzheimer’s disease when he was still in his early 50's. In this 6-minute video we follow...
Influence of automation on Aβ1-42/Aβ1-40 ratio and its use
Automation is an important step in the direction of more standardization as it limits the number of manual handling steps and therefore minimizes...

Comparison of Aβ1-42/Aβ1-40 ratio with other ratios
CSF Aβ1-42/Aβ1-40 is a tool to normalize values of patients with different amyloid levels, as other ratios might be seen more as interpretation tools...
How to work with Aβ1-42/Aβ1-40 ratio
One cause of discordant results can be the preanalytical conditions, e.g. when laboratories use tubes that bind certain proteins. Aβ1-42 adsorption is...

Improvement of AD risk scores by use of the Aβ1-42/Aβ1-40 ratio
Different scores have been developed to provide an interpretation of biomarker results for AD diagnosis or risk prediction. Here we will give two...

Aβ1-42/Aβ1-40 ratio for interpretation of discordant results
By use of the Aβ1-42/Aβ1-40 ratio, discordant results (i.e. when amyloid and tau biomarkers are not concordant) can be improved. However, while the...

Use of the Aβ1-42/Aβ1-40 ratio to improve accuracy of AD diagnosis
It is widely agreed that, since cerebrospinal fluid (CSF) is in direct contact with the central nervous system (CNS), analytes measured in this body...

What is Alzheimer's disease?
Alzheimer’s disease, which is the most common form of dementia, is an incurable degenerative disease. Neurons in certain parts of the brain are...

 Powered by Bioz


 and Lumipulse G pTau 181 Calibrators set (230367)")


 and Lumipulse G β-Amyloid 1-40 Calibrators (231531)")

 and Lumipulse G β-Amyloid 1-42 Calibrators (230343)")